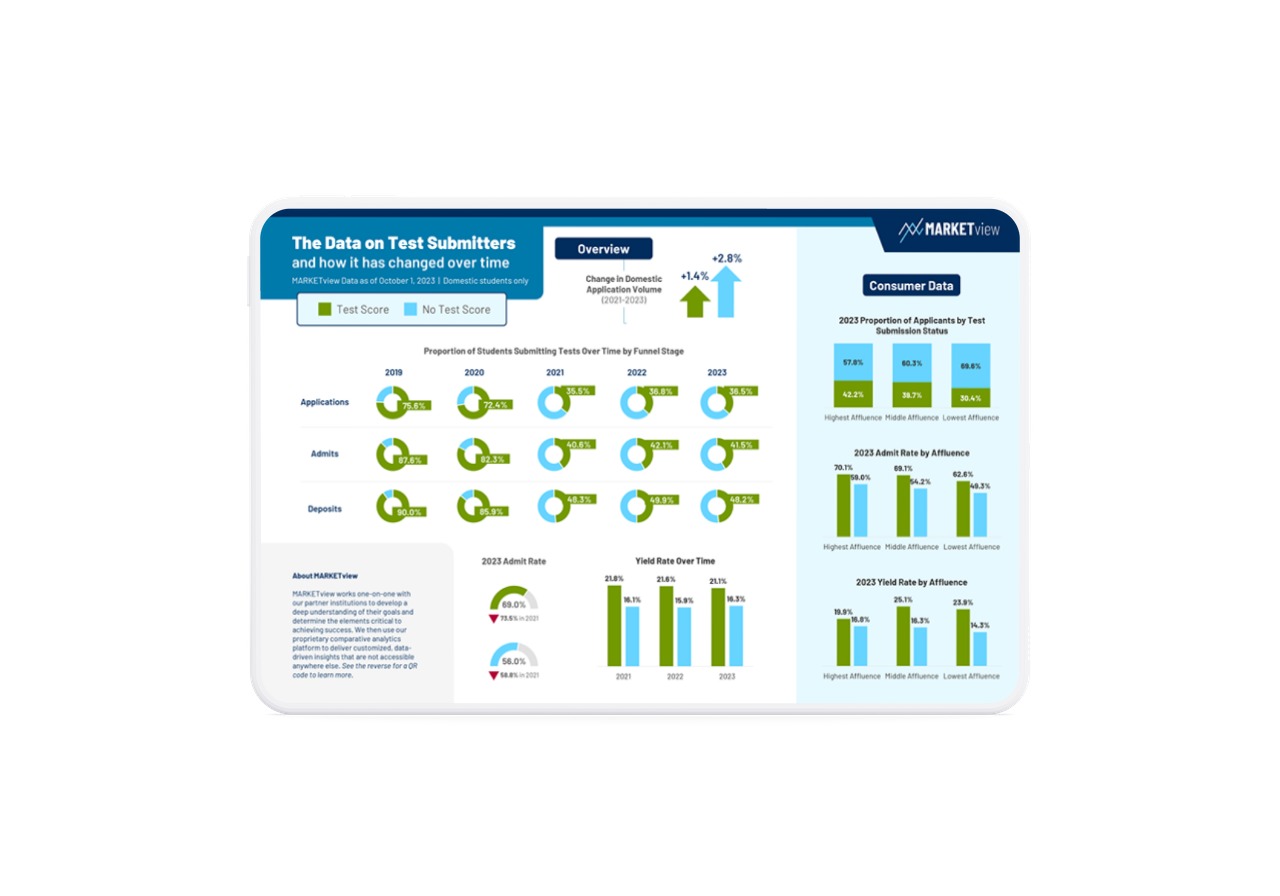
Infographic:
The Data on Test Submitters
(and how it has changed over time)
The idea of test-optional admissions is nothing new as many institutions had adopted it long before COVID-19. Most others were forced to take on the practice during the pandemic, recognizing the difficulty that students had in preparing for, and taking tests during the global crisis.
As schools return to pre-pandemic normalcy, a large number are keeping their test-optional policies in place. How will this impact the behavior of prospective students?
This infographic from MARKETview reveals insights into the behavior of test score submitters versus those who do not submit across the past five years. Breakout data sets include:
- The proportion of students submitting tests over time by funnel stage
- The yield rates of test submitters and non-test submitters for the past three cycles
- The proportion of applicants submitting test scores by academic interest
- Trends for test-optional behavior by gender and ethnicity
- And much more...
Note: This data was referenced in a recent virtual forum presented by The Chronicle of Higher Education with support from MARKETview.

